
Bitcoin’s Make-or-Break Week: Election Shockwaves & New All-Time High in Sight!
The Perfect Crypto Storm...

TL;DR:
As Bitcoin enters a critical week, we're eyeing several key events that could set the stage for the crypto market’s next major move. November 5—just days away—brings not only the U.S. election but also an unprecedented potential for Bitcoin’s new weekly all-time high close. Add in the macro factors like institutional inflows and global economic shifts, and we’re looking at a recipe for intense action. Let’s dig in.
This Week’s Key Narrative: Bitcoin Under the Microscope
On the macro scale, Bitcoin is in a tight spot. With Bitcoin ETF inflows now surpassing $20 billion—ten times what gold ETFs saw in their first year—there’s clear momentum. But don’t be fooled by the recent price dips; they’re only a small piece of this massive picture. The approaching U.S. election on November 5 marks a significant milestone historically tied to “up-only” post-election cycles. When we zoom out, these cycles show higher highs, and with the ongoing consolidation, Bitcoin appears to be on the cusp of something big.

Historical Patterns and Election Week: The Bullish Setup
Looking back, the data paints an intriguing picture. In 2012, 2016, and 2020, Bitcoin saw a period of higher highs and lows after elections, suggesting that we’re now on the edge of a breakout move. Previous election cycles show similar trends: volatility just before the election, followed by a rally that kicked off parabolic bull cycles. This confluence of historical patterns with the current trendline setup adds weight to the anticipation.
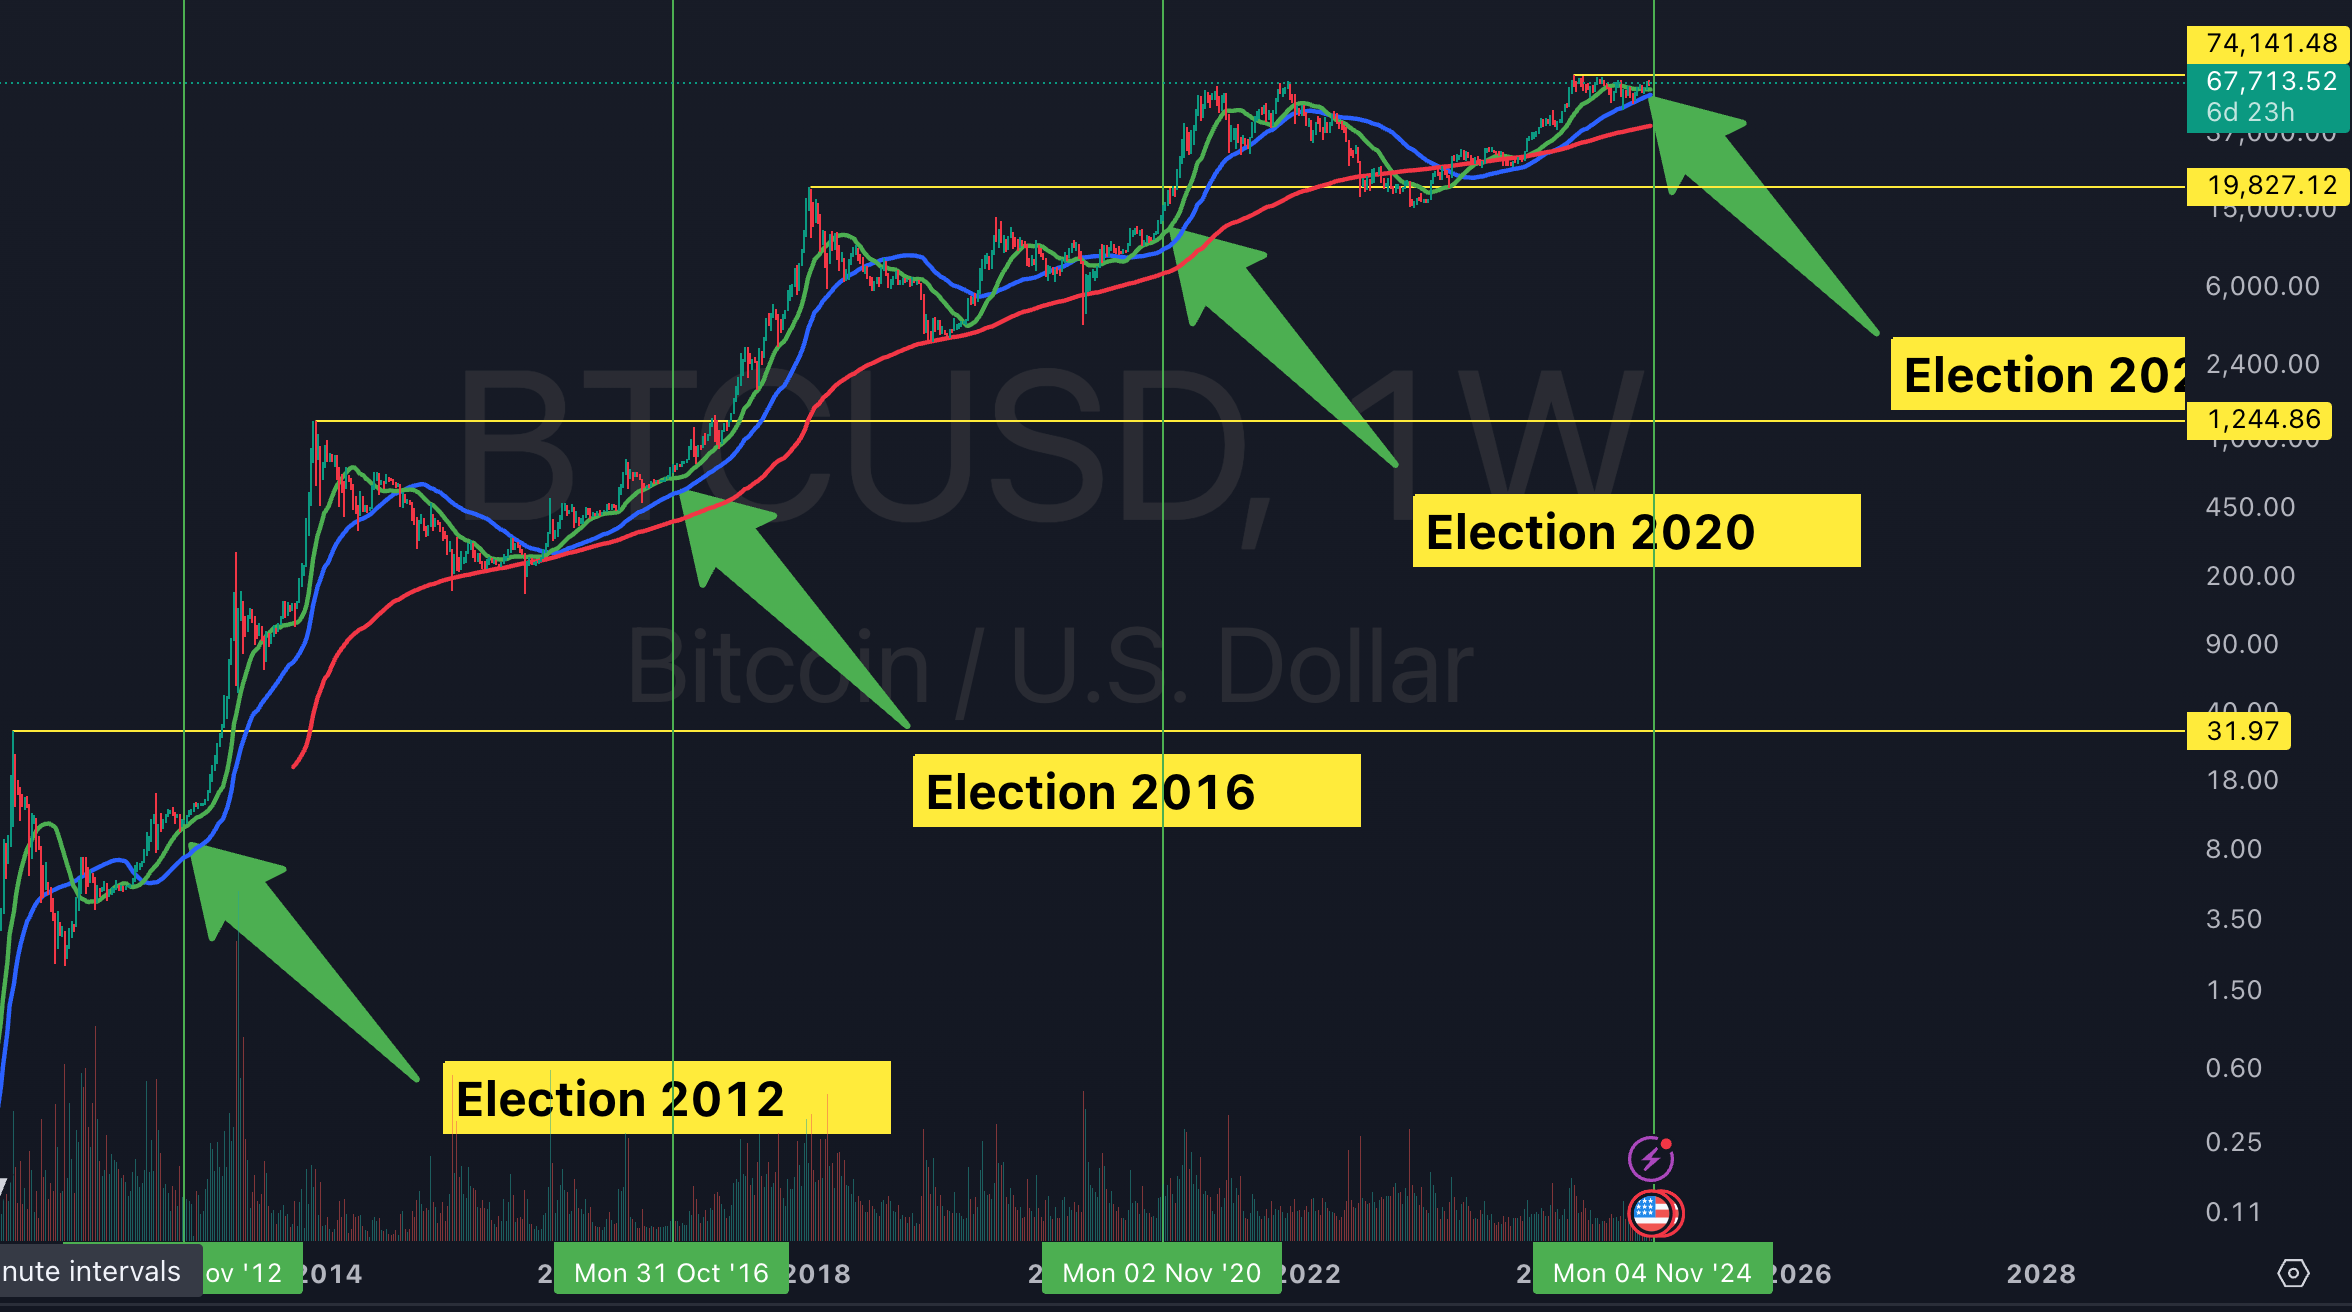
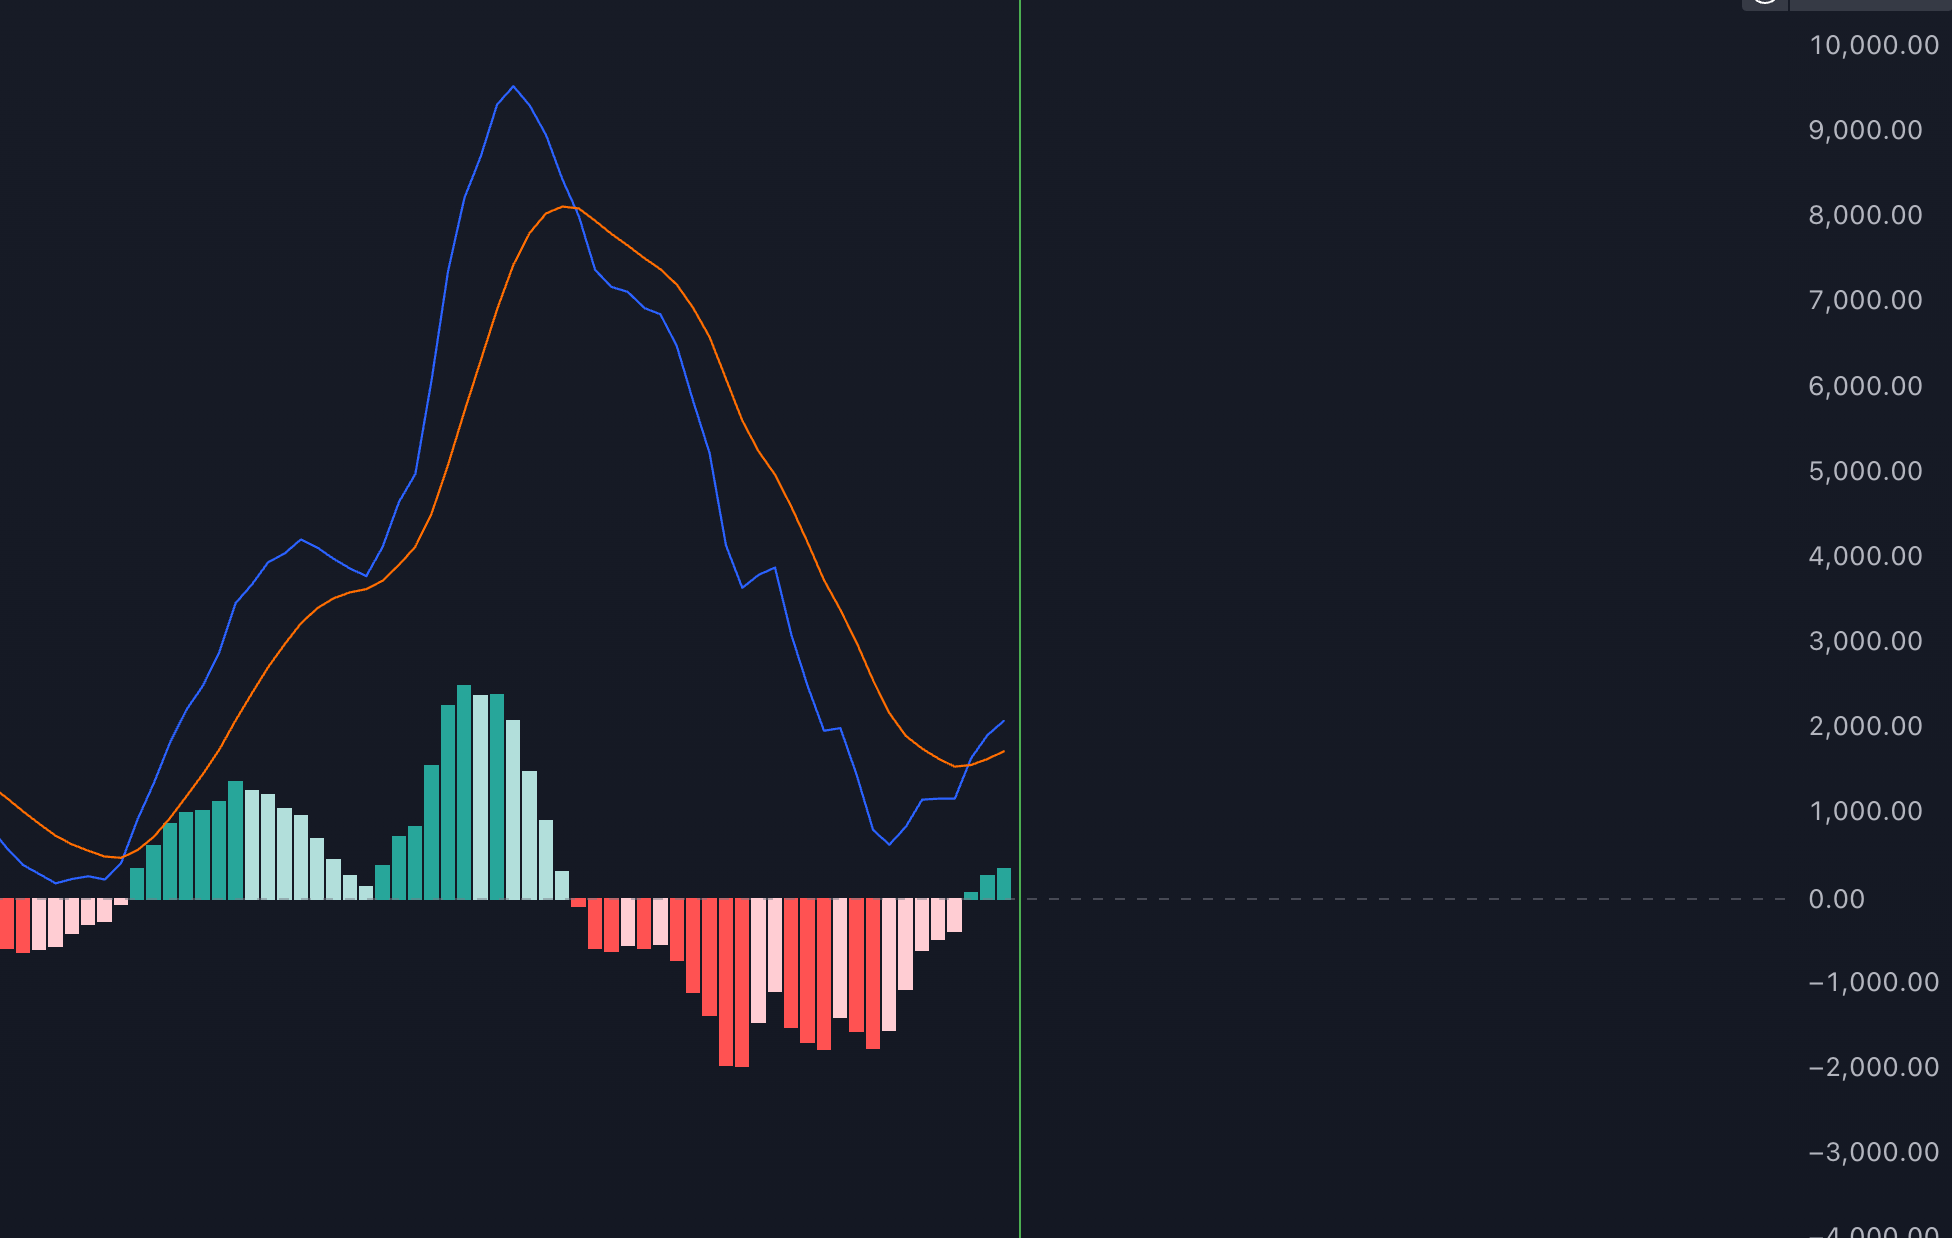
What’s exciting here is that institutional inflows, combined with the timing of the Bitcoin cycle, might just be primed for something more bullish than we’ve ever seen before. These large flows and the macro momentum indicators—like the weekly MACD shift and green histogram—hint at strength on a scale we don’t usually witness at this point in the cycle.
Zooming into the Short-Term: Support Levels & Potential Moves
For those looking at the immediate horizon, here’s the deal. Bitcoin’s weekly chart support ranges between $62K and $65K, with the 20-week moving average offering solid historical backing. If Bitcoin dips to this level, it could signal a buy-the-dip moment as we lead into the parabolic cycle.
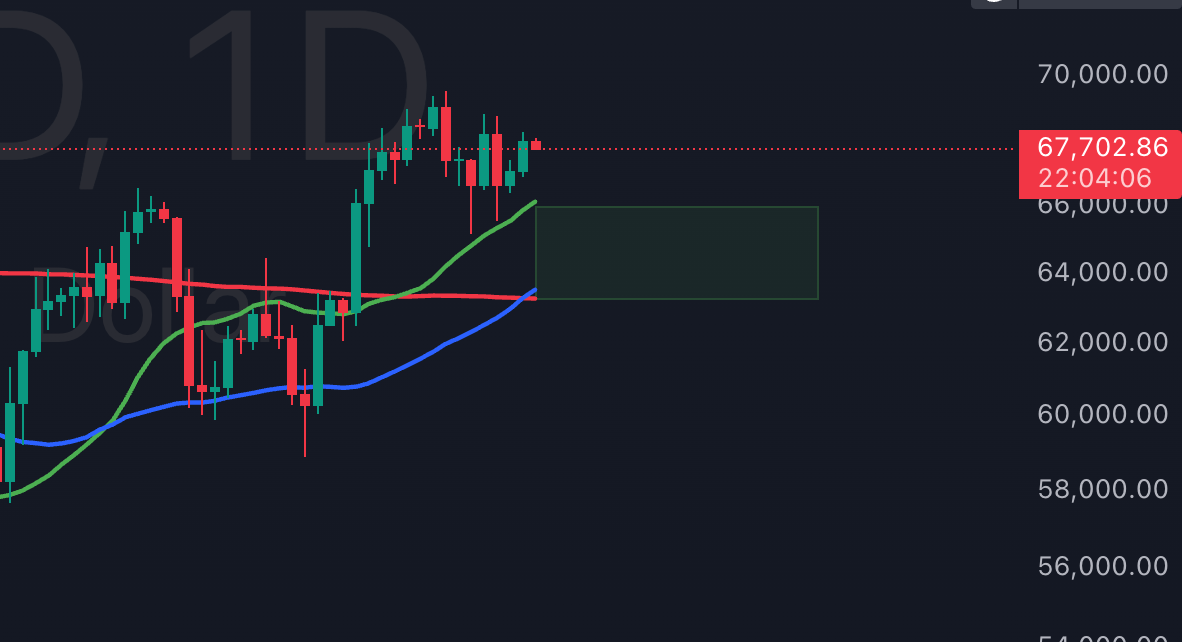
Here’s where things get even more interesting. On November 5, Bitcoin could break above a key trendline—a move reminiscent of previous cycles. If we see history repeat, this breakout could mark the beginning of an “up-only” mode for Bitcoin, which would align with the election timeline and the potential for new highs.
Beyond Bitcoin: Macro Trends & Economic Shifts
Economic factors will likely add volatility over the coming days. The U.S. dollar is overbought and near a possible retracement level, which could create room for risk-on assets like Bitcoin to rally. We’re also keeping an eye on gold; it’s pulling back from all-time highs, which historically aligns with crypto upswings. As these macro forces play out, this setup feels increasingly bullish for Bitcoin.
My Take: Prepare for What’s Ahead
This week’s setup doesn’t come around often. It’s a volatile time, and while nobody knows what is next, the data here is compelling. For those of us committed to the long-term, this is one of those moments that brings every four-year cycle back into focus. A word to the like-minded: Keep that zoomed-out perspective sharp, because history might just be getting ready to rhyme.
As always, thank you for following along. Drop a comment on YouTube if you’re tracking these markets with me, or here on my newsletter—let’s keep the discussion rolling. And if you haven’t subscribed, now’s the time. It’s only going to get more interesting from here.
God Bless!
Dan